L28ET Engine Air Flow and Turbo Compressor
Maps
Calculations:
280z Displacement = 2.753 litres = 168.00 cubic
inches
Air flow equals: Cid X RPM X 0.5 X
Ev
1728
For 6500 redline and Ev = 0.80:
Air flow equals: 168 X 6500 X 0.5 X 0.80 =
252.78cfm
1728
1lb/min = 14.472 cfm
so 252.78cfm = 17.47 lbs/min
air flow at boost = stock air flow X pressure
ratio
Pressure Ratio = (boost +
14.7)
14.7
So for 20psi of Boost @ 6500rpm:
Air flow = 252.78 X (20+14.7) =
596.69cfm or
41.23lbs/min
14.7
Air Flow Data in Table Form for different levels
of boost: (both cfm and lbs/min)
| |
Air Flow (cfm) |
| RPM |
Stock (0psi) |
7psi |
10psi |
16psi |
20psi |
| 6500 |
252.78 |
373.14 |
424.73 |
527.90 |
596.69 |
| 6000 |
233.33 |
344.44 |
392.06 |
487.30 |
550.79 |
| 5000 |
196.87 |
290.62 |
330.80 |
411.16 |
464.73 |
| 4000 |
159.44 |
235.37 |
267.91 |
332.99 |
376.37 |
| 3250 |
131.13 |
193.57 |
220.33 |
273.85 |
309.53 |
| 3000 |
122.50 |
180.83 |
205.83 |
255.83 |
289.16 |
| 2000 |
81.67 |
120.55 |
137.22 |
170.55 |
192.78 |
| 1000 |
41.32 |
60.99 |
69.43 |
86.29 |
97.54 |
| 700 |
28.92 |
42.70 |
48.60 |
60.40 |
68.27 |
| 20% of Redline Flow |
50.56 |
74.63 |
84.95 |
105.58 |
119.34 |
Calculated L28ET air flow in CFM
using Ev 0.85 to 0.80
| |
Air Flow (lbs/min) |
| Pressure Ratio |
1.48 |
1.68 |
2.09 |
2.36 |
| RPM |
Stock (0psi) |
7psi |
10psi |
16psi |
20psi |
| 6500 |
17.47 |
25.78 |
29.35 |
36.48 |
41.23 |
| 6000 |
16.12 |
23.80 |
27.09 |
33.67 |
38.06 |
| 5000 |
13.60 |
20.08 |
22.86 |
28.41 |
32.11 |
| 4000 |
11.02 |
16.26 |
18.51 |
23.01 |
26.01 |
| 3250 |
9.06 |
13.38 |
15.22 |
18.92 |
21.39 |
| 3000 |
8.46 |
12.50 |
14.22 |
17.68 |
19.98 |
| 2000 |
5.64 |
8.33 |
9.48 |
11.79 |
13.32 |
| 1000 |
2.86 |
4.21 |
4.80 |
5.96 |
6.74 |
| 700 |
2.00 |
2.95 |
3.36 |
4.17 |
4.72 |
| 20% of Redline Flow |
3.49 |
5.16 |
5.87 |
7.30 |
8.25 |
Calculated L28ET air flow in lbs/min using Ev 0.85 to 0.80
Air Flow Data Plotted Against Different Boost
Levels (Pressure Ratio vs. lbs/min)
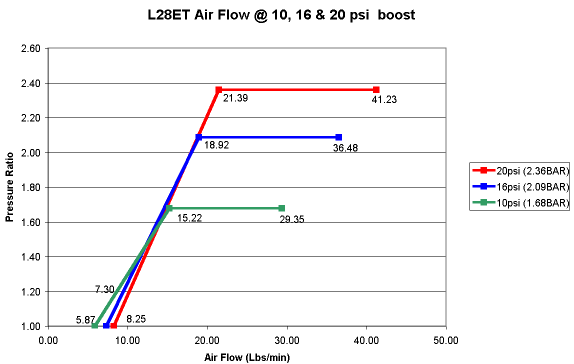
L28ET air flow in
lbs/min at 10, 16 and 20psi (1.68 / 2.09 / 2.36BAR) of
boost
- far right end points are at max boost and
redline (6500rpm)
- "knees" are half way to redline when full boost
hits (3250rpm) note: this is an arbitrary point and is dependent on A/R
ratio.
- far left "start" point is 20% of redline flow
and pressure ratio of 1BAR note: this is also
arbitrary
Air Flow Data Plotted Against Different Boost
Levels and Transcribed to "Stock" Garrett
T3-60 Compressor Map (Pressure Ratio vs. lbs/min)
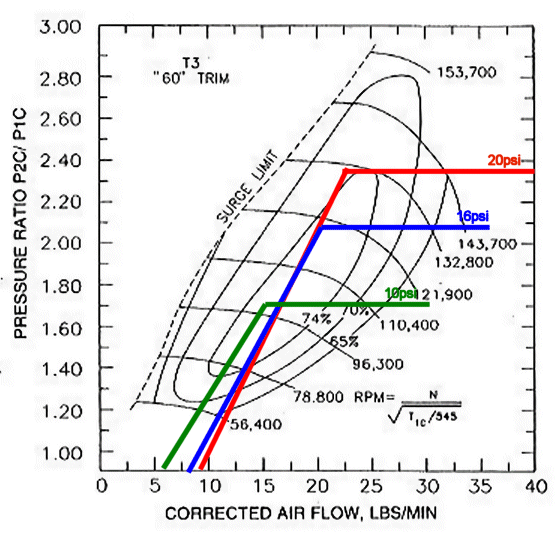
- 6500 rpm red line points for this compressor at
all three levels of boost are at the 60% or lower efficiency range. This means
the compressor is making a lot of heat in these regions. The boost range from
10 to 16psi holds near 60% at redline but it quickly gets worse as the boost
is increased toward 20psi.
- Since the "knee" is ~3250 rpm, and it is in the
74% efficiency "sweet spot" this compressor will work well between 3250rpm and
4500rpm
- This compressor is optimized for low boost small
displacement engines
- Goldilocks says "too small, too
hot"
Air Flow Data Plotted Against Different Boost
Levels and Transcribed to Garrett T61 Compressor Map (Pressure Ratio vs.
lbs/min)
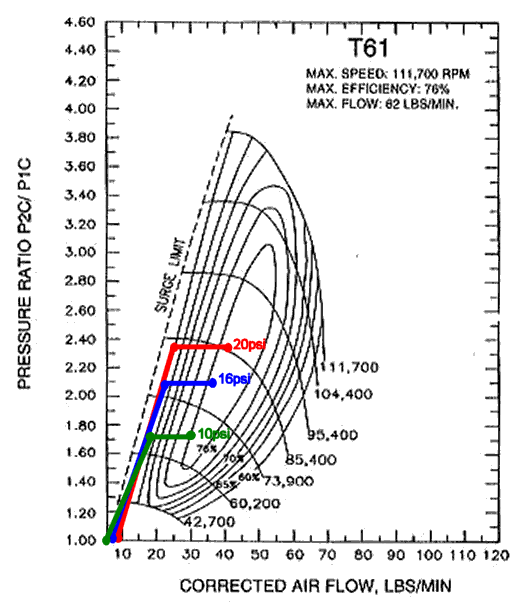
- 6500 rpm red line points for this compressor, for
all three levels of boost, are in the 76% "sweet spot"
- 3250 rpm "knee"
points for this compressor, for all three levels of boost, are in the 66% area
near the surge limit. This region is where the flow is not sufficient to spin
the turbo wheels.
- This big compressor will give poor performance
unless running full out near red line. Therefore; it is great for drag
applications and not so great for the street.
- Goldilocks says "too big"
Air Flow Data Plotted Against Different Boost
Levels and Transcribed to Garrett T04E-50 Compressor Map (Pressure Ratio
vs. lbs/min)
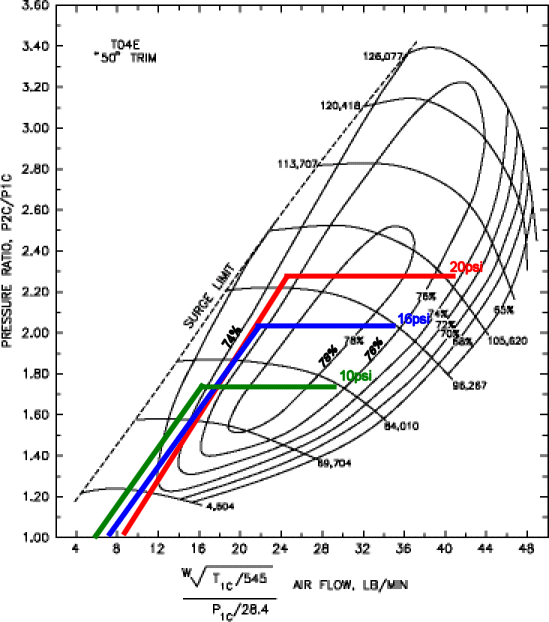
- 6500 rpm red line points for this compressor at
all three level of boost are in the 75% +/- 1% efficiency region.
- 3250 rpm "knee"
points for this compressor at all three level of boost are in the 74% +/- 1%
efficiency region.
- When accelerating towards redline, the efficiency
passes through the maximum 78% area, thus performance is ideal during this
period.
- It should be obvious that this compressor can
handle even more boost and remain very efficient above the 20psi line. "It can
grow with your need for more speed"
- This compressor will give great performance
compared to the stock T3-60.
- Goldilocks says "just right"
Air Flow Data Plotted Against Different Boost
Levels and Transcribed to Garrett T04B-60-1 Compressor Map (Pressure
Ratio vs. lbs/min)
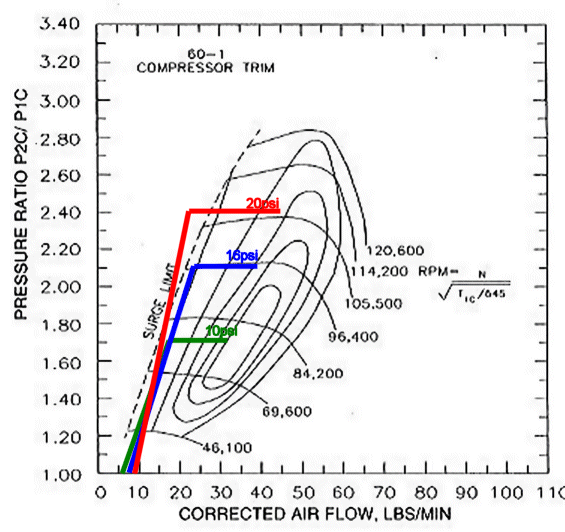
- 6500 rpm red line points for this compressor all
fail to reach the highest efficiency region.
- 3250 rpm "knee" points for this compressor at all
three levels of boost are in the surge threshold region
- It should be obvious that this compressor will
work better with a larger displacement engine as it's sweet spot is far to the
right where higher flows are required.
- Goldilocks says "too demanding"
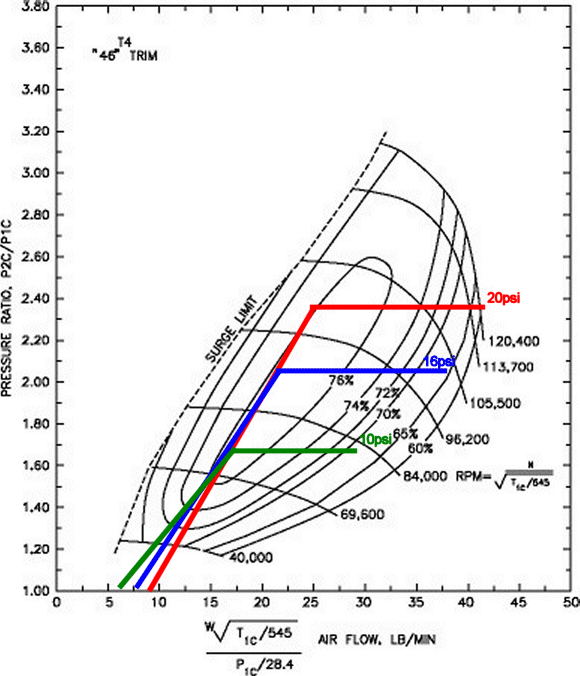
- 6500 rpm red line points for this compressor at
all three level of boost are in the 60-75% efficiency region.
- 3250 rpm "knee" points for this compressor at all
three level of boost are in the 76% +/- 1% efficiency region.
- When accelerating towards redline, the efficiency
drops out of the maximum 76% area, thus performance decreases as rpms increase
though this is not as bad as the T3-60 above
- It should be obvious that this compressor will
work best for lower flowing engines with boost between 8 and
12psi.
- This compressor will give slightly better
performance performance to the stock T3-60.
- Goldilocks says "not a significant change from
stock"
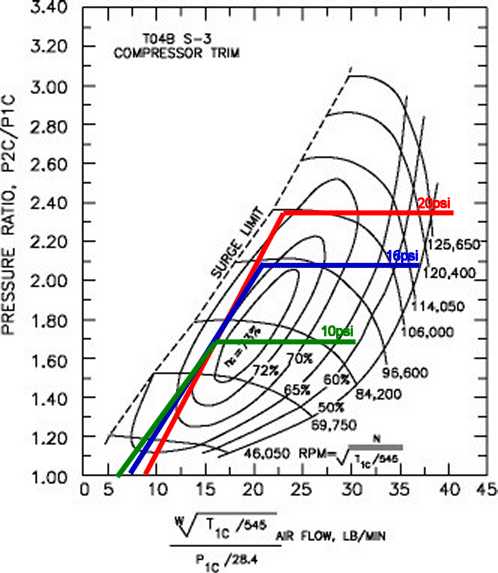
- 6500 rpm red line points for this compressor at
all three level of boost are in the 45-60% efficiency region.
- 3250 rpm "knee" points for this compressor at all
three level of boost are in the 69 to 72% efficiency region.
- When accelerating towards redline, the efficiency
drops out of the maximum 73% area, thus performance decreases as rpms increase
though this is not as bad as the T3-60 above
- It should be obvious that this compressor will
work best for lower flowing engines with boost between 8 and
12psi.
- This compressor will give slightly better
performance performance to the stock T3-60.
- Goldilocks says "not a significant change from
stock"
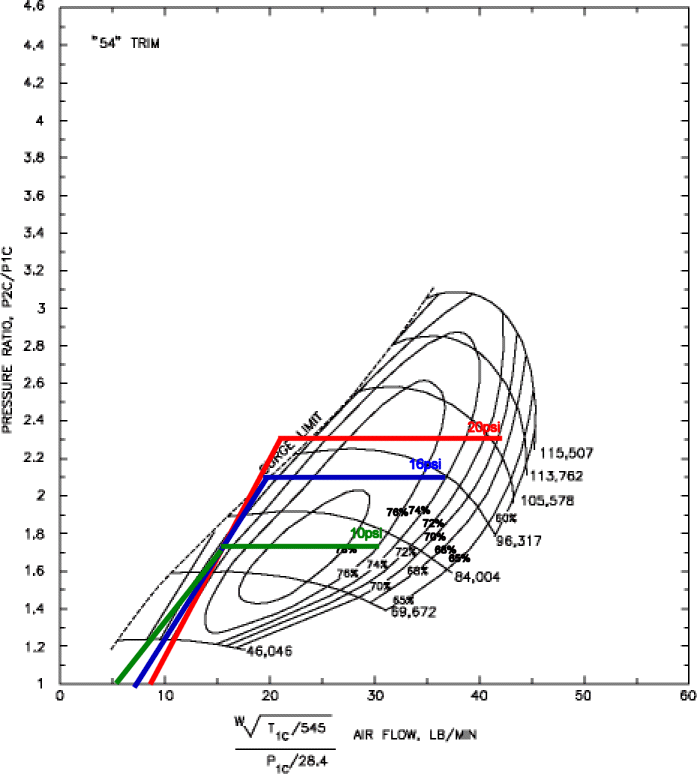
- 6500 rpm red line points for this compressor at
all three level of boost are in the 70 to 76% efficiency region.
- two of the 3250 rpm "knee" points for this
compressor are below the surge limit so a dual stage boost controller is
needed to only let the high boost at higher rpms's
- When accelerating towards redline, the efficiency
passes through the maximum 78% area at 10psi and 76% at 16 and 20psi, thus
performance is ideal during this period.
- It should be obvious that this compressor can
handle only slightly more boost above the 20psi line.
- This compressor will give great performance
compared to the stock T3-60.
- Goldilocks says "ok but not most efficient and
needs dual stage boost controller"
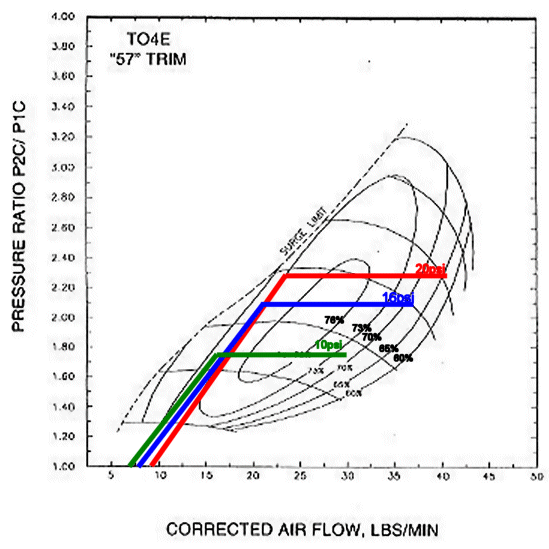
- 6500 rpm red line points for this compressor at
all three level of boost are in the 65 to 72% efficiency region.
- 3250 rpm "knee" points for this compressor at all
three level of boost are in the 73% efficiency region.
- When accelerating towards redline, the efficiency
passes through the maximum 76% area, thus performance is ideal during this
period.
- It should be obvious that this compressor can
handle only slightly more boost above the 20psi line.
- This compressor will give great performance
compared to the stock T3-60.
- Goldilocks says "ok but not most efficient"
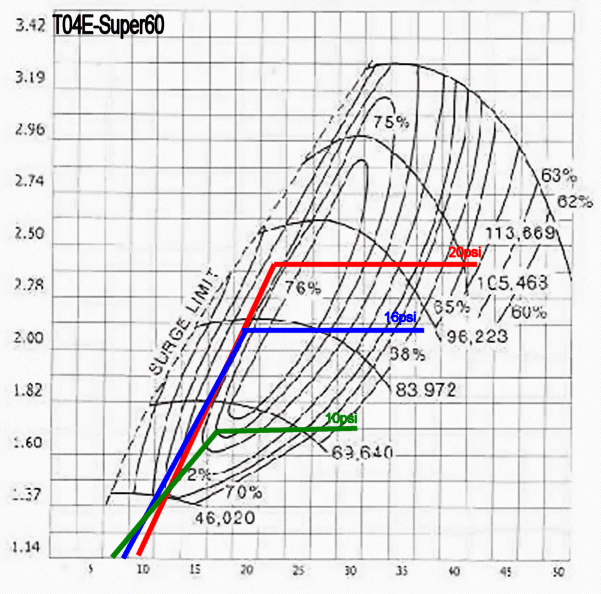
- 6500 rpm red line points for this compressor at
all three level of boost are in the 65 to 68% efficiency region.
- 3250 rpm "knee" points for this compressor at all
three level of boost are in the 77% efficiency region.
- When accelerating towards redline, the efficiency
passes through the maximum 76% area for 16 and 20psi, thus performance is
ideal during this period.
- It should be obvious that this compressor can
handle slightly more boost above the 20psi line and 10psi boost is just
OK.
- This compressor will give great performance
compared to the stock T3-60.
- Goldilocks says "ok but not most efficient"


